


Search Results for Tag: data visualization
Innovative journalism and advocacy projects
 The rapid rise of mobile phones, the Internet and above all, social media is making it easy for even small media organizations and advocacy groups to create journalism networks or develop innovative digital projects that have an impact. From documenting the disappearance of trees in the Amazon rainforest to giving a voice to the illiterate in India or connecting journalists covering Colombia’s conflict, onMedia gives you a snapshot of interesting projects from around the world.
![]() read more
read more


![]()
Creative ways of World Cup storytelling

Photo: J Mark Dodds, (CC BY-NC-ND 2.0)
With such a frenzy around everything related to football and the World Cup in Brazil, media departments are madly experimenting with how they can grab readers’ attention. One thing they are doing is coming up with some stunning ways of telling football stories with numbers. From a slick image of the most popular beer in each World Cup country to a map displaying how comfortable different nationalities are about the idea of a national player coming out as gay, there is literally something out there for everyone.
Every day, our colleagues over at DW Innovation are combing the internet for innovative visualizations, infographics and storytelling all around the 2014 Brazil World Cup. Their collection is in a ScribbleLive document embedded below – this means that you just have to check back to this blog post and it will update automatically with DW Innovation’s daily discoveries.
![]() read more
read more
![]()
Why you should use graphs or charts in stories
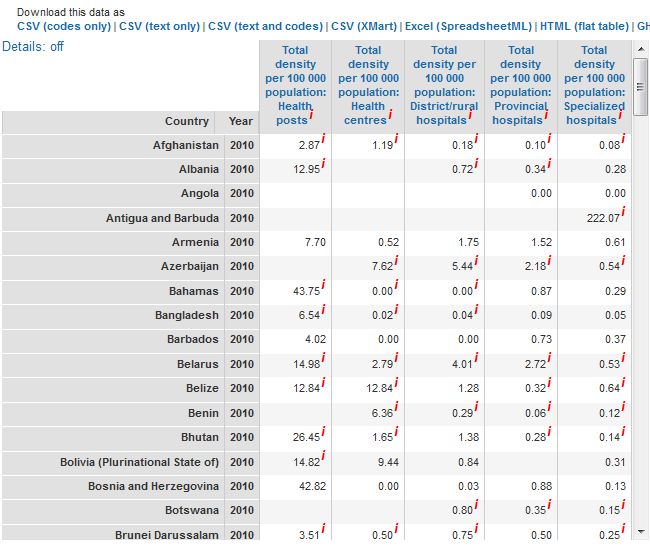
Screenshot of WHO health infrastructure statistics
We are big fans of visualizing data and we’ve produced several blog posts exploring trends in data journalism and useful tools such as datawrapper and infogr.am that can help you get started.
But sometimes, in all the hype around investigating huge sets of data, we might forget that visualizing even small amounts of information can be great for your stories.
Crunching numbers and interpreting statistics are a part of the daily grind of journalism. They help us back up a statement or prove something. They also show trends. However, numbers are often confusing or the concepts behind them are difficult to understand, especially when they are written out in a text. This is where graphs or charts can help. This post will give you some quick examples to demonstrate how simple graphs, charts or iconographs can make numbers easier to understand or more interesting for your readers. Then hopefully, you’ll be inspired to create your own!
![]() read more
read more
![]()
Gregor Aisch: ‘Journalists need to overcome their fear of hackers’
 Interactive visualizations and info-graphics are gaining popularity in the media. More and more journalists are becoming interested in producing data-driven stories on their own or with the help of developers. So what do aspiring data journalists need to know? What do they need to keep in mind when working with developers, how much programming do journalists actually need to understand – and what are the best tools to get started?
DW Akademie’s Natalia Karbasova talked to the German visualisation architect and interactive news developer Gregor Aisch. Among other things, Gregor has worked on the development of Datawrapper, a tool that allows journalists to build simple interactive charts. He also develops visualizations for media organisations such as Deutsche Welle and Zeit Online.
“Journalists need to overcome their fear of the so called hackers,“, says Gregor. “This might sound funny to some, but many people still have these mental image of criminal suspects spending their days and nights writing viruses and trying to crack security systems of banks and governments”.
![]() read more
read more
![]()
Feedback